• Skip to primary navigation
  • Skip to main content
  • Skip to primary sidebar
Menu
  • Science Experiments For Kids
  • Science Fair Projects
  • Preschool Science
  • Science Facts
  • Printable Experiments
  • Science Sparks Books
  • Science Questions
  • Contact Me
Science Experiments for Kids
Menu
  • STEM Challenges
  • Early Years Science
    • Preschool Science
    • Sensory and Messy Play
    • Understanding of the World
    • Pirate Science Experiments
  • Primary Science
    • Baking Soda Experiments
    • Candy Experiments
    • Biology
    • Climate Change for Kids
    • Coding for Kids
    • Chemistry
    • Electricity for Kids
    • Magic Science Experiments
    • Harry Potter Experiments
    • Human Body Science
    • Air Pressure Experiments
    • Life Cycles
    • LEGO Science Experiments
    • Kitchen Science
    • Famous Scientists
    • Forces and Motion
    • Science Sparks Snippets
    • Key Stage 1 Science
      • Animals
      • Everyday Materials
      • Plants
      • Coding Activities
      • Humans and Health
      • Fine Motor skills
      • Science and Literacy
    • Key Stage 2 Science
      • Animals, Including Humans
      • Electricity
      • Light
      • Plants
      • Materials and their Properties
  • Key Stage 3
  • Holiday Science
    • Christmas Science
    • Halloween Science
    • Easter Science
  • Storybook Themed Science Experiments
  • Wonderful Women in STEM
menu icon
go to homepage
search icon
Homepage link
  • FREE Experiments
  • Science for Kids
    • Kitchen Science
    • Climate Change
    • Egg Experiments
    • Fairy Tale Science
    • Edible Science
    • Human Health
    • Chemistry
    • Inspirational Women
    • Forces and Motion
  • Science Fair Projects
  • STEM Challenges
  • Science Sparks Books
  • Contact Science Sparks
    • Email
    • Facebook
    • Instagram
    • Twitter
    • YouTube
  • ×

    Home » Primary Science » Key Stage 1 Science » LEGO Bar Charts

    LEGO Bar Charts

    May 21, 2018 By Emma Vanstone 3 Comments

    Recording data is a very important part of any scientific investigation. You should decide how the data will be recorded in the planning stages before starting the experiment. A table is often the simplest method, and from there, data can be taken and analysed. We’ve drawn tables before in our viscosity investigation.

    This activity is designed to introduce the concept of  a bar chart using LEGO. We completed a simple sorting activity first and then plotted the data LEGO bar chart.

    Bar chart made using DUPLO
    DUPLO Bar Chart

    What you need for a LEGO bar chart

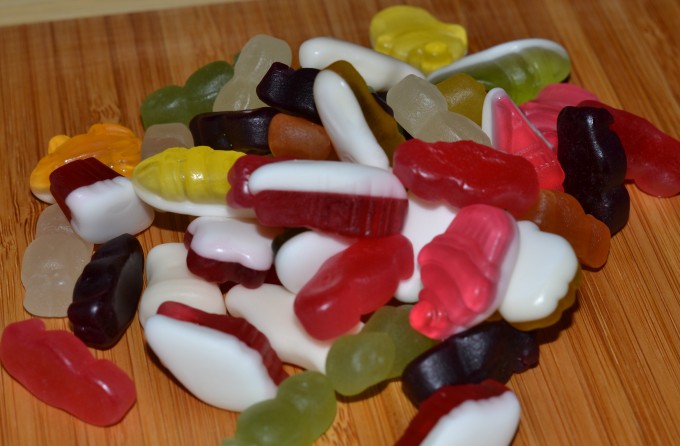
    A bag of sweets / different shaped LEGO / anything else you want to sort

    DUPLO/LEGO

    Pens and paper

    pile of sweets ready to sort as part of a science activity

    Instructions

    Decide how to sort your items, we discussed sorting by type of sweet, size and colour, but settled on colour

    Count and record the number of each item. We drew a simple table to record the type of sweet and number of sweets.

    Think about how you’ll plot the data on a graph.

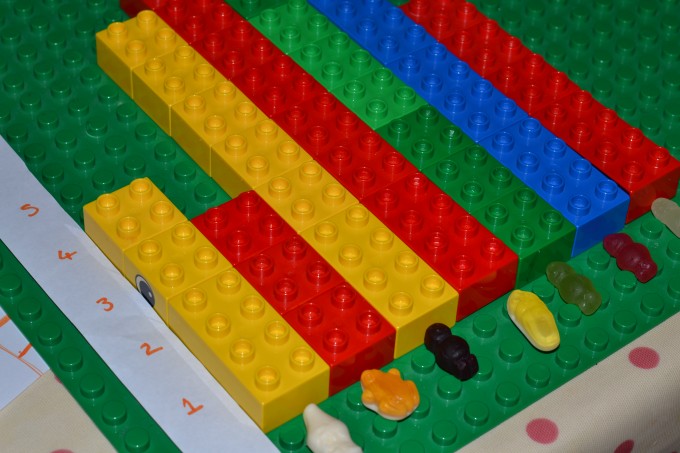
    • The different groups should be on the x – axis ( Horizontal ) with Number up the y – axis ( Vertical )*
    • Do you have space to have each bar be 1, or do you need to go up in 2’s or even 10’s?

    * Normally you put the things you control across the x-axis and the things you are measuring up the y axis

    What do you think of our LEGO bar chart?

    Image of DUPLO used to make a bar chart.
    DUPLO Bar Chart

    A graph is just a way of conveniently displaying data.  Depending on the complexity of the data you can infer things very quickly from a graph that doesn’t necessarily come out when just looking at a table of numbers.

    Last Updated on May 25, 2021 by Emma Vanstone

    « Rolling Ball Box
    Rockford’s Rock Opera – the ecological musical »

    Safety Notice

    Science Sparks ( Wild Sparks Enterprises Ltd ) are not liable for the actions of activity of any person who uses the information in this resource or in any of the suggested further resources. Science Sparks assume no liability with regard to injuries or damage to property that may occur as a result of using the information and carrying out the practical activities contained in this resource or in any of the suggested further resources.

    These activities are designed to be carried out by children working with a parent, guardian or other appropriate adult. The adult involved is fully responsible for ensuring that the activities are carried out safely.

    Reader Interactions

    Comments

    1. Trisha @ Inspiration Laboratories

      November 12, 2013 at 6:00 pm

      This is such a great way to work on bar graphs!

      Reply
    2. [email protected] Measured Mom

      November 15, 2013 at 3:01 am

      Love this original idea for working with bar graphs! Pinning! Thanks for sharing at the After School linky 🙂

      Reply
    3. MyTutoring

      November 21, 2017 at 4:33 am

      Great idea for for working with bar graphs. Thanks for sharing this post.

      Reply

    Leave a Reply Cancel reply

    Your email address will not be published. Required fields are marked *

    Primary Sidebar

    • Email
    • Facebook
    • Instagram
    • Twitter
    • YouTube

    What are you looking for?

    JOIN US!

    Get new experiments straight into your inbox every week!!

    Thank you!

    You have successfully joined our subscriber list.

    .

    Footer

    ↑ back to top

    Science Sparks - FREE science experiments for kids

    Newsletter

    • Sign Up! for emails and updates

    Contact

    • Contact
    • Privacy Policy
    • Services
    • Media Kit
    • FAQ

    As an Amazon Associate I earn from qualifying purchases.

    Copyright © 2022 Science Sparks - Wild Sparks Enterprises Ltd